

Most trading-bot comparisons rank strategies with clean price charts and ignore whether the orders could actually fill. This benchmark framework takes the opposite approach: no strategy receives a result unless its market data, fees, delay, slippage, partial fills, and position lifecycle can be reproduced.
This is the public methodology for the Polytrade Polymarket BTC Bot Benchmark 2026. It defines how five-minute and fifteen-minute Bitcoin strategies should be tested. It does not publish invented returns or a premature leaderboard. Verified result tables can be added only after a complete replayable dataset passes the checks below.
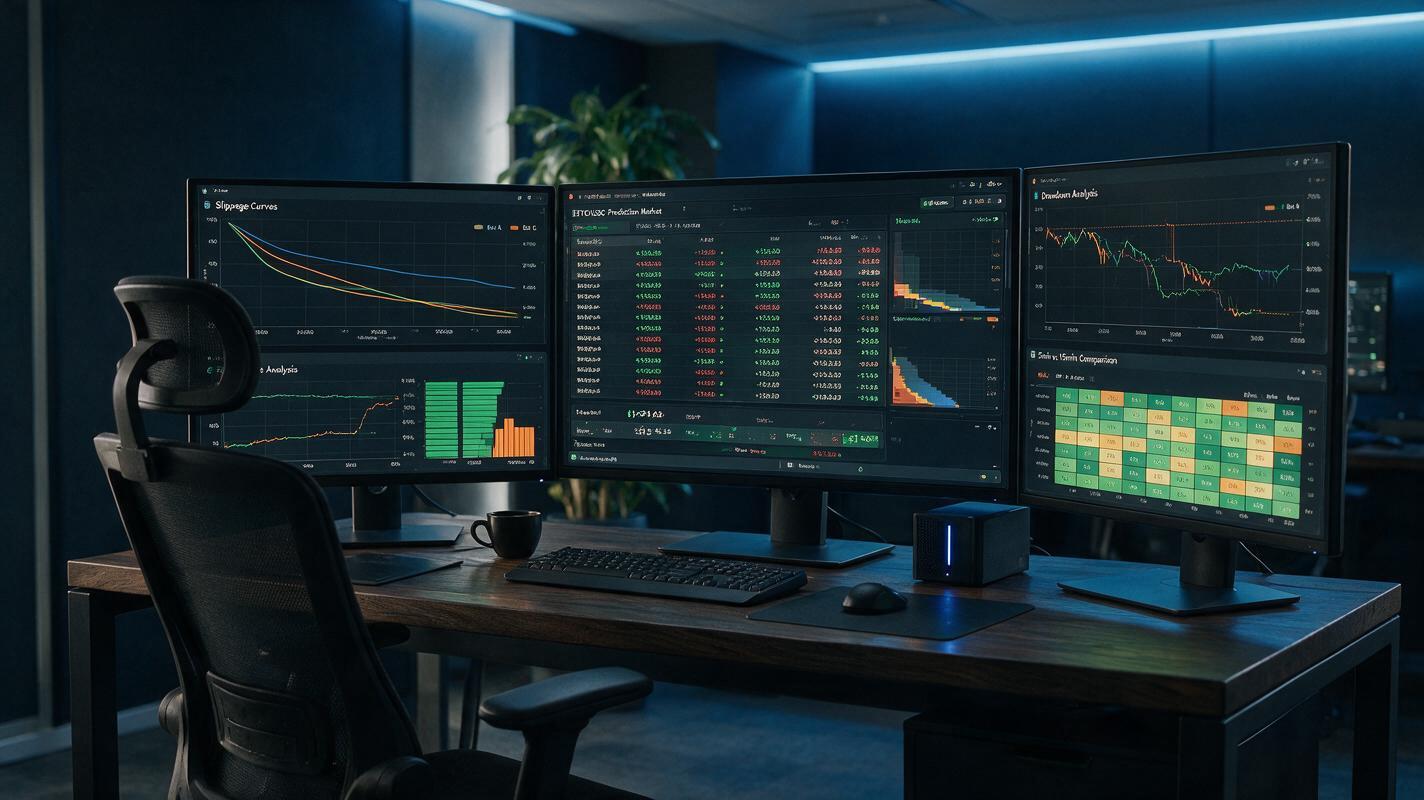
What this benchmark is designed to answer
- Does the strategy still have positive expectancy after current fees?
- How much modeled profit disappears through spread and slippage?
- How often can the requested size actually fill?
- What happens after the configured taker delay?
- How much capital is trapped in unmatched or unresolved inventory?
- What is the maximum drawdown and worst single-window loss?
- Does performance survive different volatility and liquidity regimes?
- Can another researcher reproduce the same result from the same inputs?
Why final prices are not enough
A candle can show that BTC moved up, but it cannot show the price a Polymarket bot could obtain. The bot trades a central limit order book. A buy consumes asks; a sell consumes bids; larger orders can cross several levels.
The official Polymarket price and order-book documentation exposes resting bids, asks, timestamps, tick size, minimum order size, and book hashes. The same documentation supports batch reads for up to 500 order books, which is useful for synchronized snapshots across outcomes and related windows.
A benchmark based only on midpoint history will overstate fill quality. Every simulated trade in this framework uses executable levels.
Benchmark universe
The intended universe contains consecutive BTC up-or-down markets with five-minute and fifteen-minute horizons. Each market record must preserve:
| Field | Purpose |
|---|---|
| Market and condition IDs | Stable references for metadata and analytics |
| UP and DOWN token IDs | Connect each outcome to its order book |
| Start and end timestamps | Define the exact test window |
| Opening reference | Sets the directional threshold |
| Resolution rule and source | Prevents mismatched settlement assumptions |
| Tick and minimum size | Ensures simulated orders are valid |
| Fee schedule | Calculates real net performance |
| Final resolved outcome | Determines payout |
The official market-discovery guide documents event, market, condition, and token identifiers. The market-details guide documents state, trading constraints, and fee fields.
Data collection standard
A replayable dataset needs synchronized market and reference data. Each snapshot should include:
- timestamp from the source;
- full UP and DOWN bids and asks to the maximum tested size;
- book hash or sequence information;
- last trade and recent trade flow;
- BTC reference value and its observation timestamp;
- seconds remaining;
- market status and fee parameters;
- strategy state and current inventory.
Polymarket publishes 30-second and 60-second Chainlink-computed BTC/USD TWAP updates through RTDS. The official TWAP guide distinguishes the Chainlink observation timestamp from the publisher timestamp. The benchmark stores both and never substitutes an unrelated exchange price for the official resolution rule.
The five strategies under test
The initial benchmark compares the position patterns described in our five BTC bot strategies guide:
| Strategy | Benchmark question |
|---|---|
| Dynamic position rotation | Does repeated repricing overcome switching costs and whipsaw? |
| Temporal arbitrage | How often can opposite outcomes form a net sub-$1 pair? |
| Inventory market making | Do spread and rebates exceed adverse selection and inventory loss? |
| Hedged directional | Does the net bias cover the cost of the paired hedge? |
| Late-resolution capture | Do small near-final discounts survive fees and rare reversals? |
Each strategy receives the same market data, capital, maximum order size, and risk budget. Strategy-specific parameters must be fixed before the out-of-sample period.
Fair probability and signal calibration
Directional strategies need a probability estimate, not a binary guess. Inputs can include distance from the opening reference, remaining time, realized volatility, BTC momentum, order-book imbalance, and related-window behavior.
Predicted probability should be calibrated. If a model labels 100 trades at 70% confidence, roughly 70 should win over a sufficiently large representative sample. A strategy that wins less often than its quoted probability is overconfident even if short-term PnL looks attractive.
| Calibration bucket | Required report |
|---|---|
| 50%–59% | Predicted count, realized win rate, net return |
| 60%–69% | Predicted count, realized win rate, net return |
| 70%–79% | Predicted count, realized win rate, net return |
| 80%–89% | Predicted count, realized win rate, net return |
| 90%–99% | Predicted count, realized win rate, tail loss |
Execution model
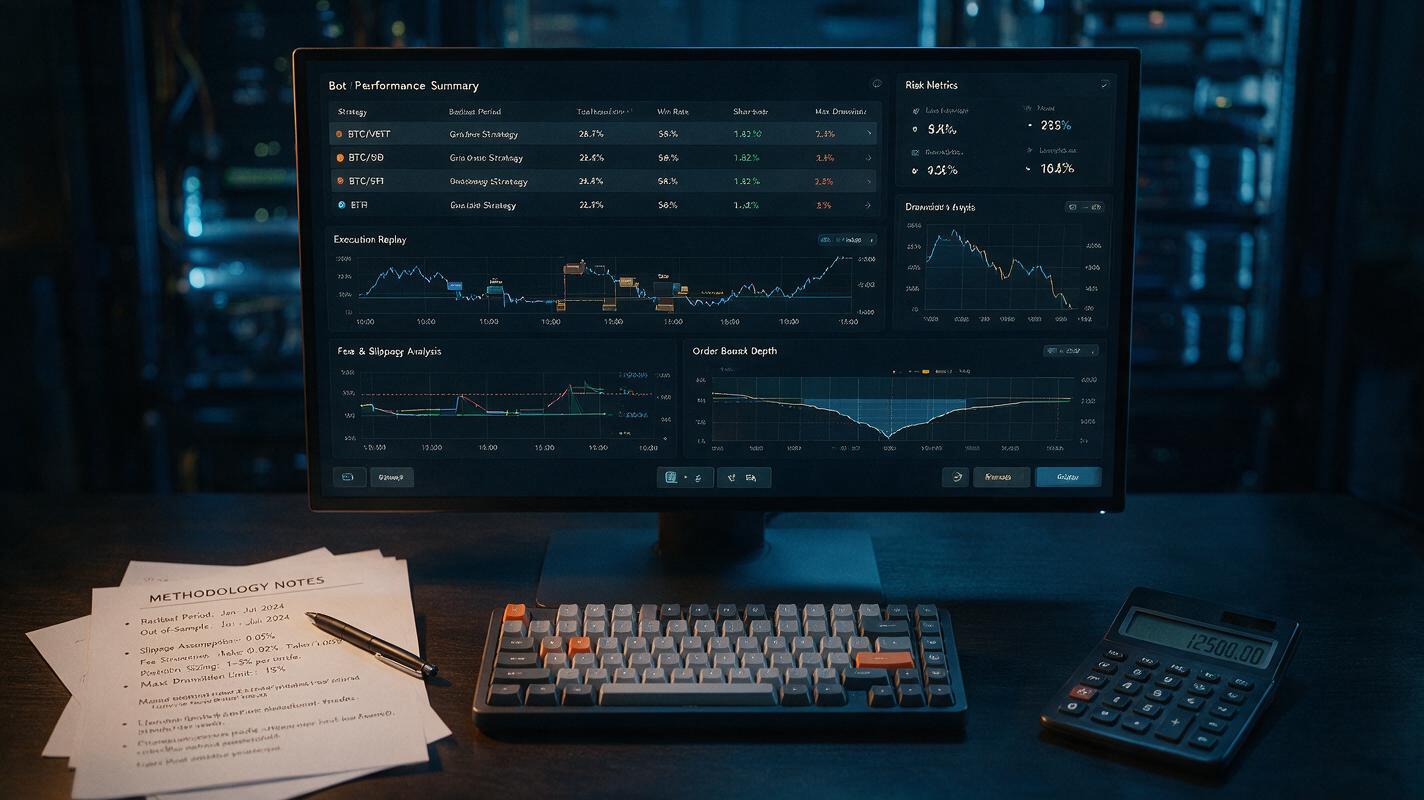
For every proposed order, the replay walks through actual depth until one of three conditions occurs: requested size fills, the worst acceptable price is reached, or available liquidity ends.
Depth-weighted average price = total cost across consumed levels ÷ filled quantity
The simulator records full fill, partial fill, or skip. It never invents liquidity at the best ask or bid.
Selected crypto up-or-down markets may apply a taker delay. The official order lifecycle documentation currently describes a 250 ms hold on configured markets. The benchmark therefore reports at least three scenarios:
| Scenario | Purpose |
|---|---|
| Zero-delay diagnostic | Shows theoretical signal quality, not a live claim |
| Documented delay | Models the configured taker hold |
| Stress delay | Tests slower data and network conditions |
Fee model
The benchmark reads the fee schedule attached to each market. It does not assume every market or participant pays the same rate.
The current Polymarket fee documentation states that makers are not charged trading fees and that taker fees fund rebate programs. Taker fee amounts vary with price. Any rebate is reported separately from trading PnL so strategy performance remains understandable.
Net PnL includes:
- entry and exit fees;
- spread;
- depth slippage;
- forced-unwind cost;
- unfilled quantity;
- realized maker rebates, shown separately;
- settlement payout.
Position lifecycle reconstruction
Short-window bots cannot be evaluated from isolated trades. A bot may buy UP, add DOWN later, sell part of UP, and finish with paired inventory plus a small directional bias.
The benchmark reconstructs:
- average cost by outcome;
- paired quantity;
- unmatched directional quantity;
- realized and unrealized PnL;
- rotation count;
- time spent unhedged;
- maximum inventory;
- final settlement value.
This prevents temporal arbitrage from being misclassified as random direction switching and prevents expensive hedges from being described as risk-free.
Standard metrics
| Metric | Definition |
|---|---|
| Net PnL | Settlement and sales minus purchases, fees, and unwind costs |
| Return on deployed capital | Net PnL relative to capital actually committed |
| Maximum drawdown | Largest peak-to-trough decline in benchmark equity |
| Fill rate | Filled quantity relative to requested quantity |
| Skip rate | Signals rejected by price, depth, delay, or risk rules |
| Average slippage | Difference between signal price and depth-weighted fill |
| Worst-window loss | Largest net loss in one market window |
| Tail-loss ratio | Largest losses relative to typical wins |
| Calibration error | Difference between predicted and realized outcome frequency |
| Capital utilization | Share of capital tied up in active or unmatched positions |
Regime analysis
A single average hides where a bot works and fails. Results should be grouped by:
- five-minute versus fifteen-minute horizon;
- quiet, normal, and high BTC volatility;
- tight versus wide spread;
- deep versus thin books;
- early, middle, and late-window entry;
- trending versus choppy BTC movement;
- maker versus taker execution;
- time of day and day of week.
A strategy that earns only in one regime should be described as regime-dependent, not universally profitable.
Preventing overfitting
- Freeze strategy rules before the test period.
- Separate training, validation, and out-of-sample windows.
- Include every eligible market, not only attractive examples.
- Report failed, skipped, and partially filled orders.
- Use walk-forward evaluation when parameters require updating.
- Publish sensitivity tests for fees, delay, and slippage.
- Do not tune on the final benchmark period.
Benchmark results policy
This page publishes the benchmark methodology first so every future result can be reproduced. Strategy rankings will be added only after a complete historical order-book sample passes the data-quality, fee, delay, slippage, fill, and lifecycle checks above.
Each published result will include the number of markets tested, net PnL, maximum drawdown, fill rate, skip rate, average slippage, worst-window loss, and performance by volatility regime. Until those fields are verified, no strategy will be labeled a winner.
Reproducibility checklist
- Market IDs and token IDs are included.
- Exact collection period is disclosed.
- Snapshot frequency and missing-data policy are documented.
- Reference-feed timestamps are preserved.
- Fee schedules are read per market.
- Order delay and slippage assumptions are explicit.
- Strategy parameters are versioned.
- Skipped and failed orders remain in the dataset.
- Every chart links back to methodology.
- Corrections receive a dated change log.
How this page strengthens the Polytrade research cluster
This benchmark is the methodology hub. Readers can continue to the technical bot-building guide, the five BTC strategy guide, the arbitrage guide, the paper-mode guide, and the wallet research framework.
Future verified charts can be embedded by other sites with a visible Polytrade source credit, giving researchers a reason to cite the original methodology instead of copying a claim without context.
Frequently asked questions
Why does this page not show a winning strategy yet?
A leaderboard without replayable order-book data would be misleading. Results will be added only after fees, delay, slippage, fills, and position lifecycles are verified.
Can final market prices be used for a bot backtest?
Not by themselves. They do not show available depth, spread, partial fills, or the price available after delay.
Why report fill and skip rates?
A profitable signal that rarely fills may have little practical value. Skips also show how risk and liquidity filters affect results.
Are maker rebates counted as strategy profit?
They are reported separately and then included transparently in total net PnL. This prevents rebates from hiding weak trading performance.
Can this methodology compare copy-trading bots?
Yes. Add leader-signal time, follower detection time, follower order-book state, copied and skipped trades, and leader-to-follower price difference.
Prediction-market and automated trading involve substantial risk of loss. A benchmark describes historical simulated or observed behavior and cannot guarantee future returns.
Register on the official Polymarket website.
Affiliate disclosure: Polytrade may receive referral rewards if you register and trade through this link, at no additional cost to you.